Debugging JavaScript in Visual Studio
TL;DR
- Start chrome in remote debug mode:
chrome.exe --remote-debugging-port=9222 - Attach Visual Studio: "Debug" -> "Attach to Process..." -> select the chrome instance
- Done.
Justifying a use case
So you are still reading? Fine, than I can do some rambling. I was developing a JavaScript WebApp with some complicated client code - it's built like a game loop using requestAnimationFrame and canvas to render multiple videos onscreen and playing synced audio - like most software it worked, but sometimes it would glitch and I was trying to figure out what caused it.
Now what I wanted was to debug the code, preferably from the comfort of my IDE, which happens to be Visual Studio, but while Visual Studio supports debugging JavaScript via Internet Explorer out of the box, it does not support any other browser.
More often than not, that's not a big problem, you just fire up IE, wonder why you never changed the startup page to something reasonable and use it just once for debugging.
But not in this case as I was making use of AudioContext and other shiny new WebApi stuff that are available in Chrome and Firefox already but - you guessed it - not in IE.
You could of course do what everyone else would do and use the built-in chrome developer tools, which are great imho, but that would incur the cost of mental task switchs for using a different IDE that does not share the same syntax highlighting, hotkeys and general workflow you have come to be so productive with. So for the sake of this article I count switching to a different tooling as giving up.
Wondering if it's possible...?
So I started wondering, if the big V is able to debug javascript running in chrome.
The first hint, that the consensus is that it won't work, was for me that out of the box selecting chrome as your browser in visual studio and starting your debug session does not work, while it does for IE.
Quick Robin, to the googlemobile!
But the googlemobile failed hard this time, top search results was talking about a Native Client and C++ code and a thread from last year said that it's not possible and Visual Studio's integrated Extension search turned up nothing.
But on the other hand, I've already tried Visual Studio's Node.js Tools and I remember vividly being amazed that debugging just worked. Okay, so because Node.js and chrome both use V8 as their JavaScript engine, Visual Studio must already be able to debug it.
Fiddlin' around
So I ignored that Visual Studio does not start debugging if you are using chrome and I simply tried to attach it to chrome using DEBUG -> Attach to Process... and while that did not work, I noticed something interesting:
In the "Code Type" selection I found a listing for Webkit!
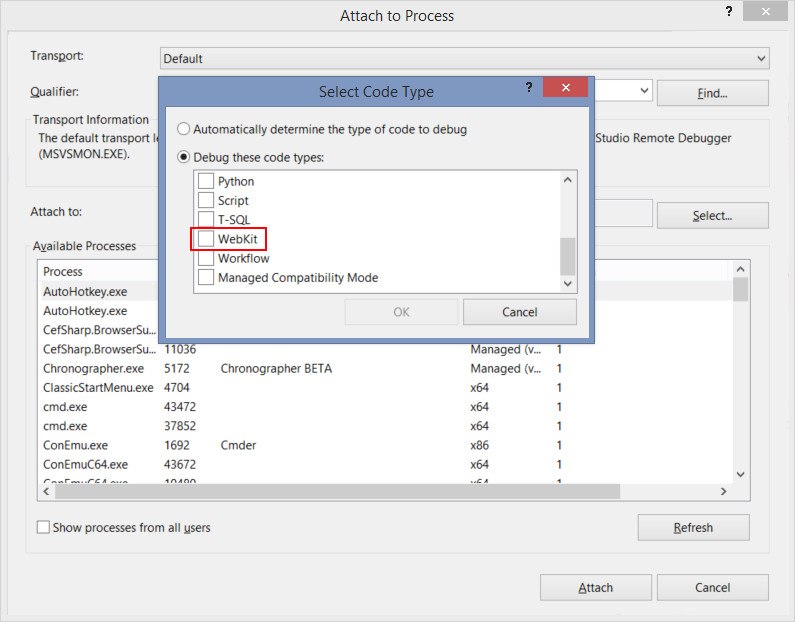
Now I knew that Visual Studio could do it and even expects me to use Debug and Attach and so it's probably chrome that doesn't cooperate, which makes sense as a sane default.
Solution
So when I returned to google again I knew what to look for and a search for chrome remote debugging brought me to this page where my the missing part for my answer was waiting:
- Start chrome in remote debug mode:
chrome.exe --remote-debugging-port=9222 - Attach Visual Studio: "Debug" -> "Attach to Process..." -> select the chrome instance
- Done.